Lambert’s law is the attenuation of the intensity of a light beam due to the (concentration-dependent) interaction with the molecules. All photometric analysis is based on this principle, which is one of the most widely used analytical principles. The extent to which the light beam interacts with the sample depends on the molecular structure of the compounds and is therefore specific to the respective substance.
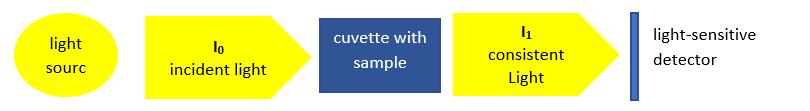
Figure 1: rough schematic structure of a photometer
First, something historical: the first connections to this were described by Pierre Burger in 1729. Johann Heinrich Lambert then built on this work. The final formula below was not achieved until 1852 by August Beer. It is a fine example of the fact that even for seemingly simple formulas and relationships the work of several experts is necessary and yet it has taken decades, or even here more than 100 years, to arrive at a usable result.
Figure 2: What happens to light on its way: It is either reflected (as in a mirror, or the green of the plants, it passes through the medium (transmission, as in a window pane) or it is absorbed in the medium (like the blue and red portion of sunlight when it hits chlorophyll). The scattering of the light beam in the medium is usually ignored (and is not shown here).

Absorbance is about absorption (i.e. how much energy is absorbed by the sample) and scattering (i.e. the deflection of part of the light rays on the sample itself). However, control is usually neglected and extinction is therefore often equated with absorption. In photometry, we assume that all the light enters the cuvette (i.e. that nothing is reflected on the surface). Well, and transmission is what we measure. In other words, how much light arrives atm detector.
The formula below is just that extinction expresses the attenuation of light in intervals of ten. Example: if you have a window pane and measure the light at, say, 400 nm and find that 90% of the light intensity passes through the slide, you get an absorbance of 0.0457. At a different wavelength (e.g.: 250 nm) almost no light comes through the window writing, since here the ultraviolet light is (fortunately) almost completely absorbed (i.e. no risk of sunburn in the living room). The extinction (or extinction) is a type of extinction. Absorption) is therefore always dependent on the respective wavelength.
Formula 1: How to calculate the absorbance from the attenuation of the light beam
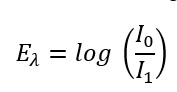
Eλ Extinction at the respective wavelength [actually not a unit since it is only a ratio, but in practice AU is often used for absorption units]
I0 Intensity of the incident light (or intensity of the light at the detector if it is not passed through the sample) [W/m²]
I1 Intensity of the transmitted light (or intensity of the light at the detector when it passes through the sample) [W/m²]
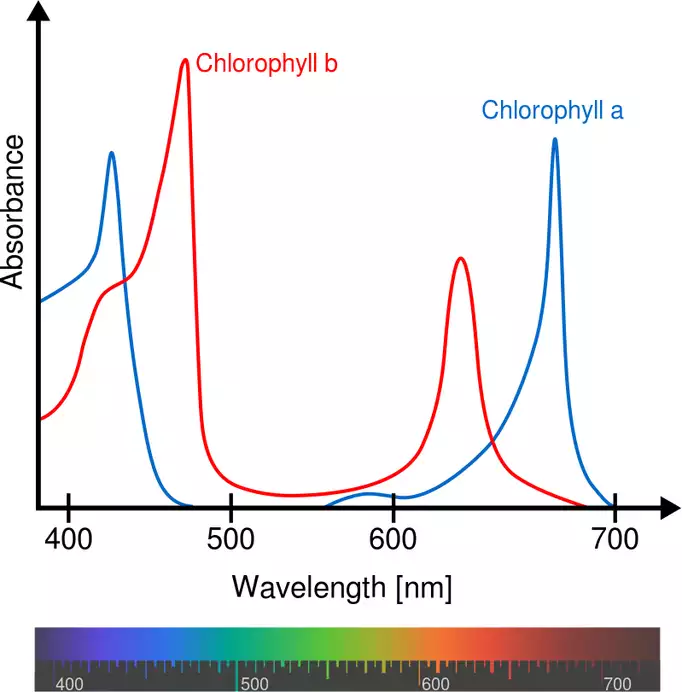
Figure 3: Example of absorption spectra of chlorophyll. Spectra represent the relationship of absorption over the wavelength. The shorter the wavelength, the more bluish the light becomes, the higher the wavelength, the redder it becomes. In the range 500 – 600 nm you can see the green gap. The unabsorbed light is reflected and can be perceived by our eyes >> which is also the reason why plants appear green to us.
However, the formula above alone does not do much in practice. In the formula below you can see that the absorbance depends on the molecular extinction coefficient, on the concentration of the sample and on the length of the light path through the sample (often referred to as the layer thickness of a cuvette).
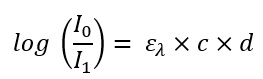
Formula 2: How to get from extinction to concentration of analyte in the sample
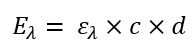
Eλ Extinction at the respective wavelength [actually not a unit since it is only a ratio, but in practice AU is often used for absorption units]
ελ molecular extinction coefficient of the molecule sought at the respective wavelength [m²/mol]
c Concentration of the sample [mol/m³]
d Layer thickness of the irradiated body [m]
When you now equate both formulas, you get a formula with which you can do something in reality. The attenuation of the intensity on the left side can be measured by optical sensors. If you now know the light path length in the sample on the right side and know what the sample consists of (and thus can look up in tables which molecular extinction coefficient is used), you can calculate the last remaining variable c = concentration.
Formula 3: And now both equations merged: How do you get from the attenuation of the light to the concentration of the sample.
A fact to keep in mind: with an absorption (or absorbance) of 1, 90% of the energy from the light remains in the sample. At an absorption of 2, it is already almost dark behind the sample (99% of the light is absorbed). In practice, this means that the differences in the concentration of the sample eventually lead to only minor changes in the amount of light absorbed. Thus, at high absorptions, one arrives in the non-linear range or in a range in which the measurement uncertainties increase sharply. Measurements should therefore be carried out up to a maximum absorption of 1.5 – 2.0. In addition, you should dilute the sample, or take a measuring cell with a shortened light path.
Table 1: Relationship between transmission and absorption
| Transmission (here in percentage of light passing through the sample) | Absorption (here in percentage of energy remaining in the sample) | Extinction |
| 90 % | 10 % | 0.045 |
| 10 % | 90 % | 1 |
| 1 % | 99 % | 2 |
| 0.1 % | 99.9 % | 3 |
For additions and suggestions we look forward to your e-mail to office@labsupport.at
Author: Dietmar Höbling